Unlock the power of VisualEyes™: Discover 10 insider tips and tricks which will enhance your clinical flow and optimize patient care. Read more.
Before starting my position with Interacoustics, I used VisualEyes™ all day every day for several years in a busy vestibular clinic. Even though I felt like I knew the software well, transitioning to the product development team has given me new insight on some tips and tricks about VisualEyes™ that I wish I knew years ago. There is so much thought and effort that goes into every aspect of software development, so I’ve compiled a list of 10 of my favorite tips and tricks I’ve learned in the last year.
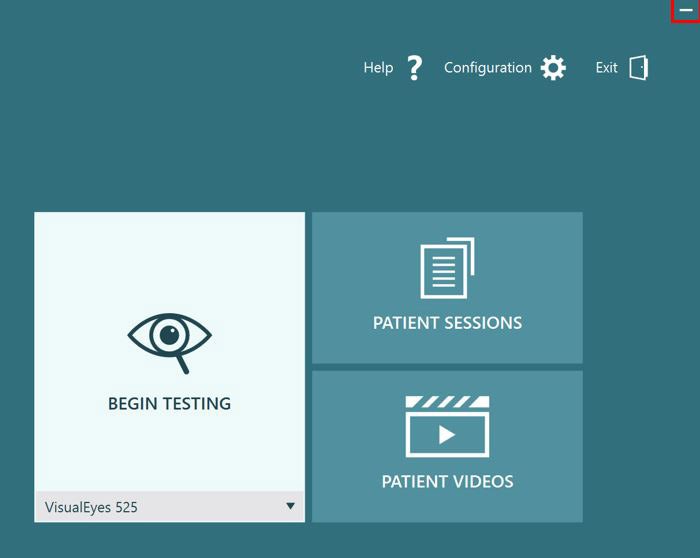
The help button on your home screen takes you to the user manual which is full of everything from test instructions to results interpretation (and much more). To access this, click the ‘help’ question mark button in the top right-hand corner (Figure 1).
In the top right-hand corner, there is a minimize button that allows you – at any time – to minimize VisualEyes™ to return to your desktop (Figure 2). This is handy when simultaneously writing reports or accessing your electronic medical records system.
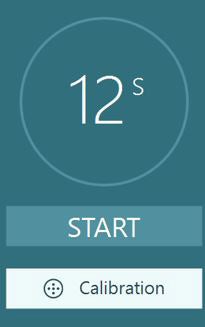
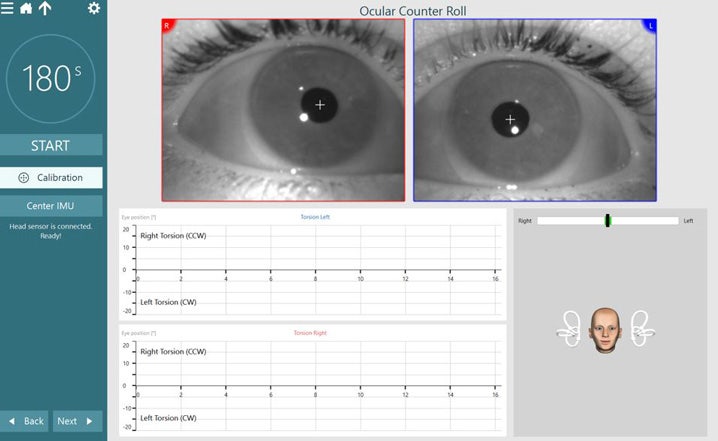
The software highlights buttons in white to show the next step in testing (Figure 3). For example, it will show you to calibrate if you have not calibrated or direct you to the ‘next’ test in your protocol.
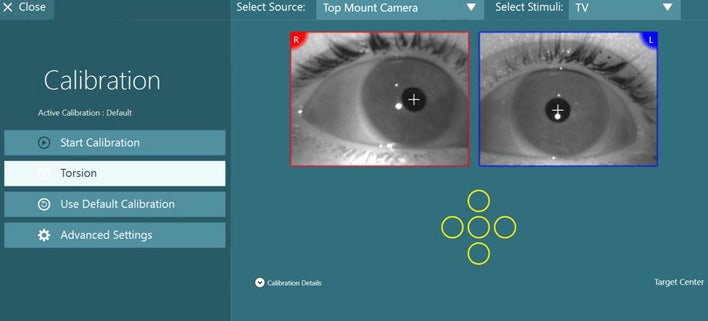
This is especially helpful in tests like the Ocular Counter Roll, as you need to calibrate torsion before beginning the test. Figures 4 and 5 show buttons highlighted indicating where to click next.
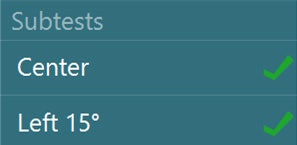
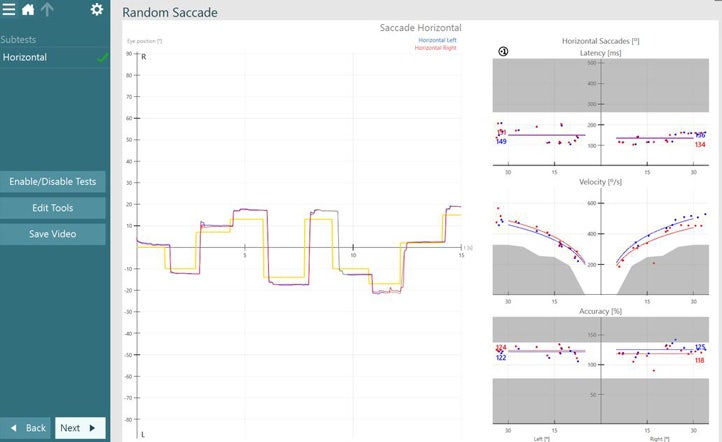
There are four symbols you may see after you complete a test, which each mean something different. A solid green checkmark means the completed test falls within test thresholds (Figure 6).
A red diamond means the completed test falls outside of test thresholds (Figure 7).
A hollow green checkmark means the completed test does not have defined test thresholds (Figure 8).
If you see a pencil beside a green checkmark (Figure 9) or red diamond (Figure 10), these results have been edited to be within or outside normal limits, respectively.
These symbols will look like this next to your completed tests (Figures 11 and 12).
If you want to override a certain test result, clicking on the red diamond (next to the title of the test/subtest) will convert it to a green checkmark with a pencil symbol, indicating that you changed the results to within threshold levels.
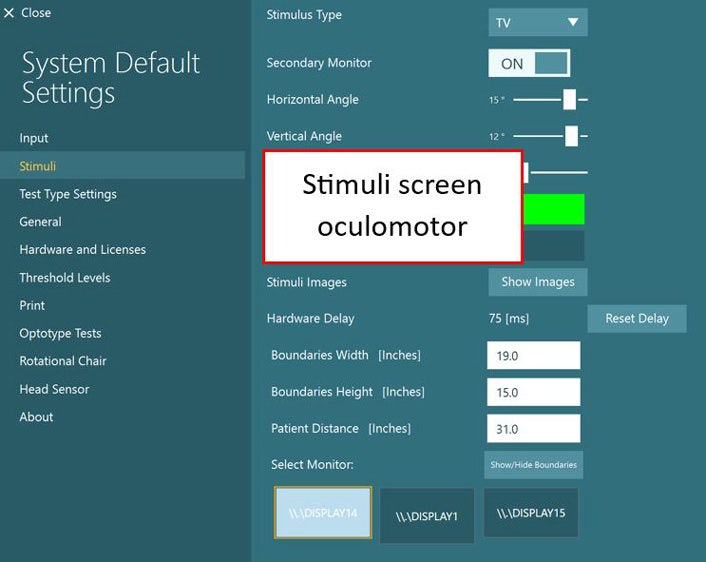
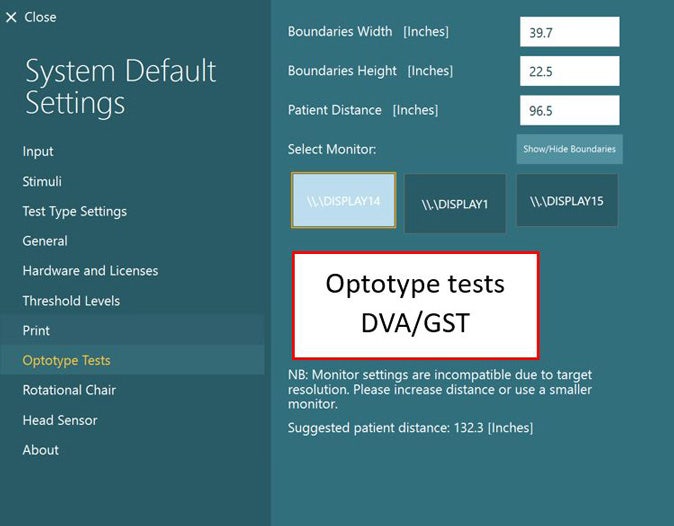
If your clinic performs oculomotor testing and head movement tests (such as dynamic visual acuity or gaze stabilization testing), there are two different stimuli screens you should check (Figures 13 and 14).
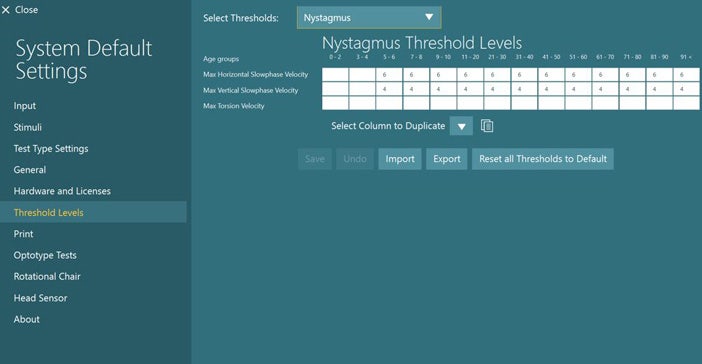
Normative thresholds are inserted by test in the ‘threshold levels’ page (Figure 15). This includes thresholds by age, and you have the ability to input your clinical normative values.
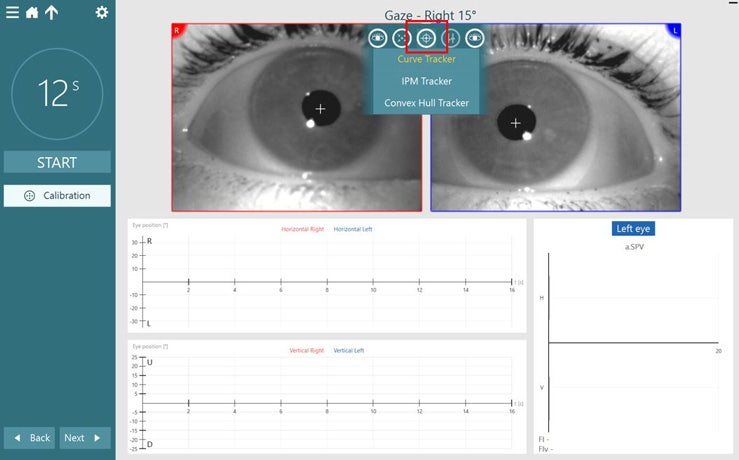
There are three nystagmus detection algorithms available in VisualEyes™. When you are setting up the patient, clicking on the middle crosshair button on the videos of the eyes reveals the nystagmus algorithms available to you (Figure 16).
This is the standard eye tracker that uses a curve recognition algorithm to isolate the pupil outline. This is what the system defaults to and works in the majority of patients.
This is a blob analysis eye tracker that locates the pupil center for high speed vHIT tracking.
This has geometric compensation for torsional tracking. Also recommended for large pupil tracking, e.g. in pediatrics.
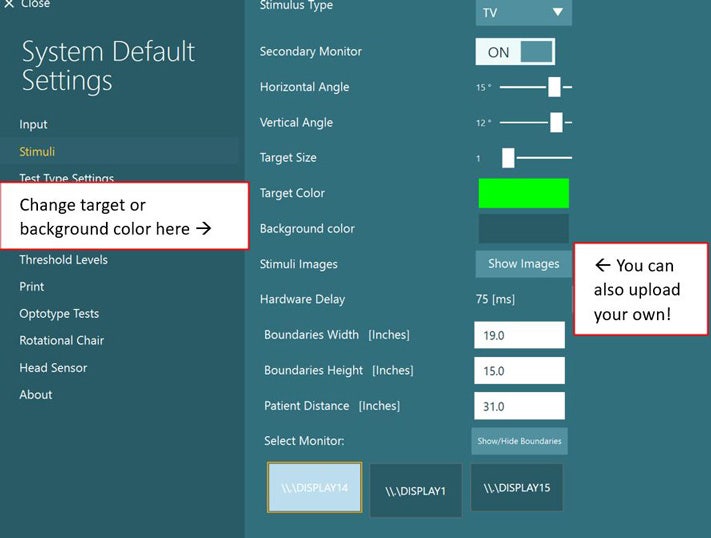
You can customize the stimuli, which is especially helpful in pediatric populations (Figure 17).
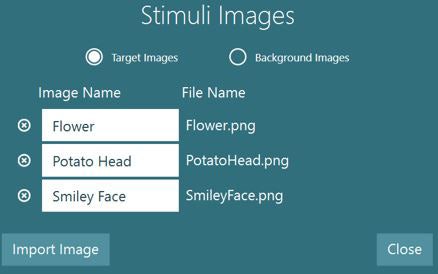
Figure 18 shows some examples of images you can replace the target with.
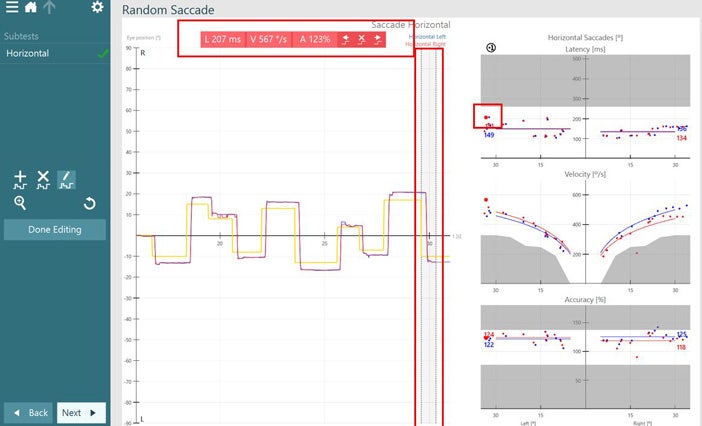
If you click on a data point while editing, it will take you to the point in the eye tracing graph. This makes sure you can make a good decision before deciding to remove a data point from the summary. Numerical data for that data point is also shown at the top of the eye tracing graph (Figure 19).
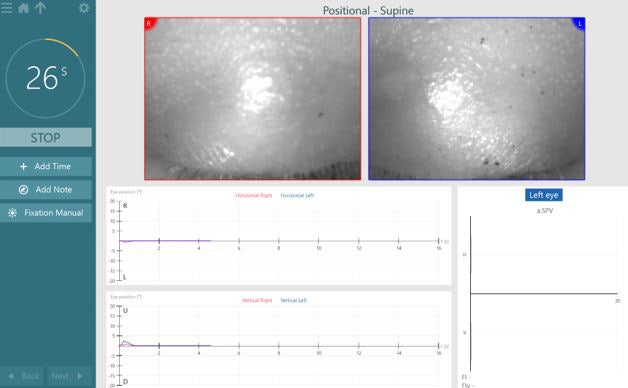
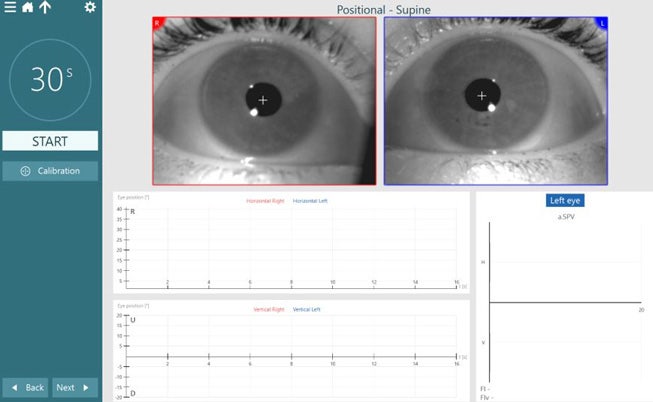
If you’ve already started a test but didn’t mean to or the patient was not ready, you can erase the data and stop the test by clicking the ESC (escape) key on your keyboard (Figure 20).
Press the escape key on your keyboard and ask the patient to open their eyes (Figure 21).
I hope at least one of these tips was helpful to you and can improve your clinical flow. VisualEyes™ is a smart software, with many features to make your patient care easier. For a full list of functions and features, see the user manual, which is available through your ‘help’ button in your software or on the VisualEyes™ support page.
Dr. Liz Fuemmeler, Au.D., is a Clinical Product Manager with Interacoustics and Vestibular Program Director at Professional Hearing Center in Kansas City, MO.