Join the Interacoustics community and receive news about new products, events and much more
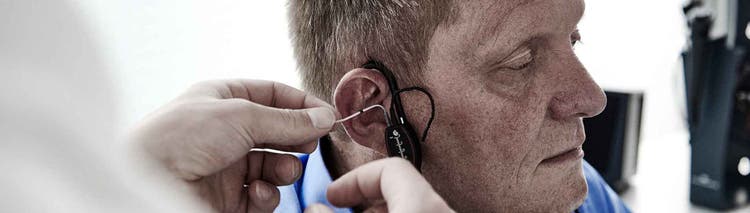
Learn how to perform probe tube placement for real-ear measurements correctly in this article by Dennis Mistry, BSc (Hons) Audiology.
The placement of the probe tube is critical when performing real-ear measurements (REMs), as it serves as your point of reference for all the measurements you’ll perform. A poor placement can be detrimental to your measurements, especially in the higher frequencies.
There is a challenge in placing the probe tube correctly due to varying ear canal shapes and sizes. And most importantly, you want to avoid touching your client’s eardrum, as this can be quite uncomfortable.
To get you going with the all-important REMs, here are four tips to guide you when inserting the probe tube.
The easiest way to avoid touching your client’s eardrum and to ensure a correct probe tube placement is to use a probe placement tool.
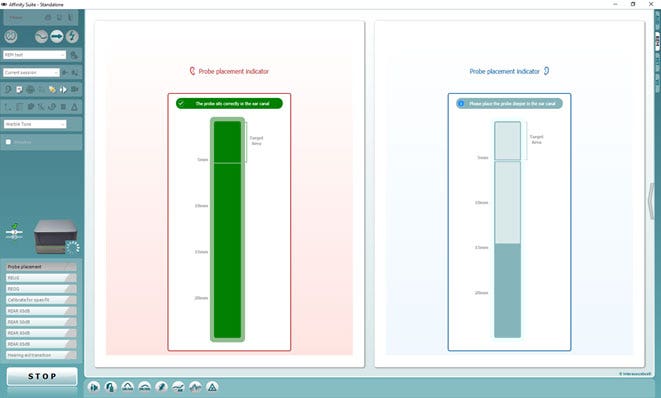
Based on machine learning, Affinity Compact’s Probe Placement Indicator shows insertion depth in real time, and provides a visible and audible signal when you’ve inserted the probe tube at the correct depth.
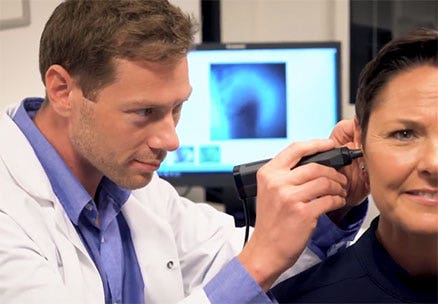
Video otoscopy allows you to identify the shape and size of your client’s ear canal, especially to identify any anomalies or points to avoid (wax or turns in the ear canal) when placing the tube.
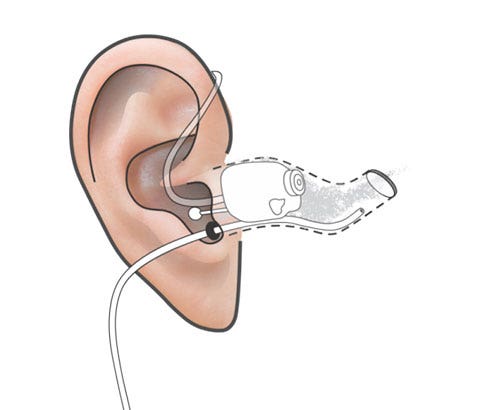
The average distance for a woman is 28 mm and for a male is 30 mm. This is the distance from the end of the tube to the marker, which should ideally position the tube within 5 mm of the tympanic membrane.
When placed, the marker should then sit at the intertragal notch and along the floor of the ear canal. Remember, this is an average distance, so:
Further video otoscopy after placement can serve as evidence for further adjustment to the tube’s placement
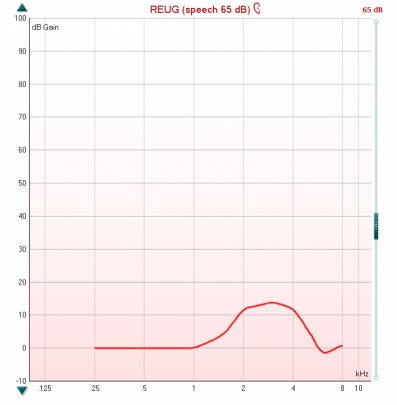
The real-ear-unaided-gain (REUG) curve can help to identify if further adjustment of the placement is necessary. In an adult, the REUG curve should begin at 0 dB Gain and then peak between 2‑4 kHz.
A low curve shape can be indicative of a blockage, due to:
The end of the tube is against the ear canal wall, or
If you get a low curve shape, you may need to replace the tube or reposition it.
Finally, the curve should dip down at roughly 6 kHz and then recover. The curve shouldn’t dip too much below the 0 dB Gain line (maximum –5 dB Gain) after 6 kHz. If it does, this suggests that the probe tube needs a deeper insertion.
All the above methods complement one another. And if you don’t have access to the Probe Placement Indicator, it’s completely fine to re-perform otoscopy, reset the marker on the tube or re‑perform your REUG measurement to get the best possible probe placement.
This procedure improves with experience too, so you’ll find yourself getting better at assessing and placing the probe with continuous practice.
[1] British Society of Audiology (2018). Verification of hearing devices using probe microphone measurements.
[2] Dillon, H. (2012). Hearing aids 2nd ed. New York, Thieme Medical Publishers.
[3] Hawkins, D., Alvarez, E., Houlihan, J. (1991). Reliability of three types of probe tube microphone measurements. Hearing Instruments, 42: 14-16.
[4] Pumford, J., & Sinclair, S. (2001). Real-ear measurement: Basic terminology and procedures. AudiologyOnline.
[5] BS ISO 12124 (2001). Acoustics: Procedures for the measurement of real-ear acoustical characteristics of hearing aids.
Dennis Mistry, BSc (Hons) Audiology, graduated from Aston University in 2011. From 2013-2022, Dennis served as a Clinical Product Manager at Interacoustics, as part of its Hearing Aid Fitting product management team.
Rasna Kaur Mistry, BSc (Hons) Audiology, graduated from The University of Manchester in 2007. Before joining Interacoustics in 2022, Rasna held several clinical audiology roles in the UK.
Learning objectives
- Perform good video otoscopy first to check that the ear canal is not shorter than the average distance