Join the Interacoustics community and receive news about new products, events and much more
In this blog, you’ll learn about the key benefits for the new Eclipse Aided Cortical module, which is a hearing device validation test.
In September, we were happy to announce the Aided Cortical module for the Interacoustics Eclipse, which helps you validate the benefit of a hearing device in infants, children, adults and other patients with complex needs, by presenting speech-like stimuli while they are wearing their hearing device.
To help you understand how this new module works and how it can deliver value in your clinic, let’s dive into five key benefits.
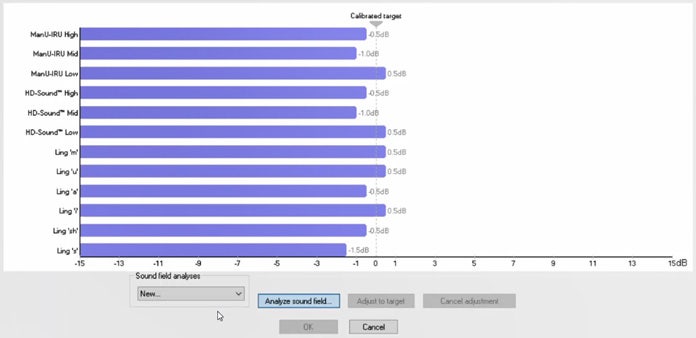
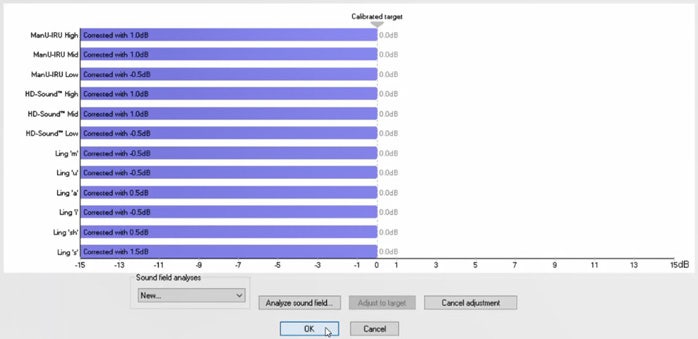
With the Sound Field Analyzer in the Aided Cortical software, it is possible to compensate for any physical changes that might have occurred in the test room between individual tests.
The sound field analysis compares the current sound field characteristics with the characteristics measured at the calibration. If you measure differences in the characteristics (Figure 1), then the Sound Field Analyzer compensates for the measured differences when presenting stimuli (Figure 2).
The sound field analysis only takes a few seconds to perform, and it allows you to ensure correct stimuli presentation in the free field setup.
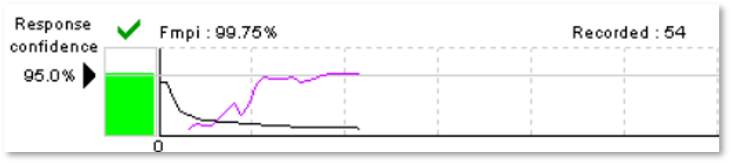
The Fmpi detector in the Aided Cortical module indicates whether there is a response in the recording, guiding the clinician during the test. The detector value is displayed as a percentage indicating the response confidence. The response confidence target can be set at either 95% or 99% as a stop criterion (Figure 3).
Since the Fmpi detector employs more points in the noise calculation and estimates the noise properties from the individual recording, you can achieve a detection faster.
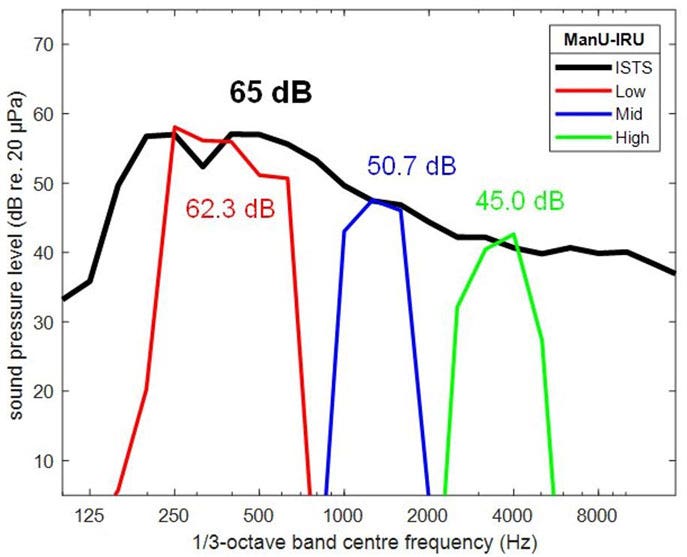
Developed and validated in collaboration between Manchester University and the Interacoustics Research Unit (IRU), the ManU-IRU stimuli are frequency-specific stimuli designed to represent typical speech sounds – ideal for aided cortical testing [1][2].
The ManU-IRU stimuli set consists of three different speech-like stimuli, stimulating the low, medium and high frequencies. By being presented with reference to the International Speech Test Signal (ISTS), this allows the clinician to test the patient’s ability to hear regular speech (Figure 4).
Two other sets of stimuli are available with the Eclipse Aided Cortical module: HD-Sounds developed by Harvey Dillon, Ph.D., and the LING sounds.
Read more: Which stimuli should be used for aided cortical testing?
As with the rest of the software modules available with the Eclipse, the Aided Cortical module offers Bayesian weighted averaging. This functionality treats recordings containing less noise with higher importance in the detection of a response compared to recordings that contain more noise.
Bayesian weighting ensures the noise in a recording does not increase during the recording, which reduces the importance of having the patient being relaxed at all times. This can be a huge time-saving benefit as patients are awake and usually sitting up during aided cortical testing.
You can learn more about Bayesian weighting in the video below.
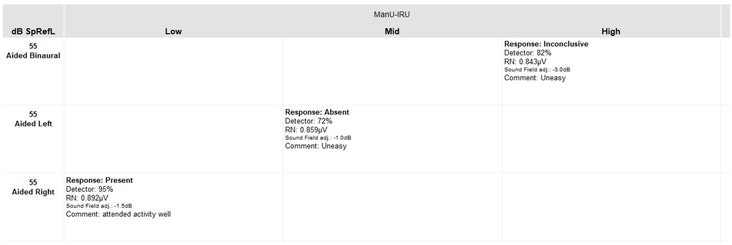
The automatically generated report in the Aided Cortical module gives a complete and organized overview of the test results – including results from previous sessions when using the ‘add to current session’ feature.
The report updates after each measurement, providing you with all the relevant clinical details including response label, detector value and more (Figure 5).
These were some of the key benefits of the Aided Cortical module, and we hope you can see how adding this hearing device validation test could add value to your clinical flows.
Explore the Aided Cortical module to discover even more benefits!
[1] Visram, A. S., Stone, M. A., Purdy, S. C., Bell, S. L., Brooks, J., Bruce, I. A., Chesnaye, M. A., Dillon, H., Harte, J. M., Hudson, C. L., Laugesen, S., Morgan, R. E., O'Driscoll, M., Roberts, S. A., Roughley, A. J., Simpson, D., & Munro, K. J. (2023). Aided Cortical Auditory Evoked Potentials in Infants With Frequency-Specific Synthetic Speech Stimuli: Sensitivity, Repeatability, and Feasibility. Ear and hearing, 44(5), 1157–1172.
[2] Stone, M. A., Visram, A., Harte, J. M., & Munro, K. J. (2019). A Set of Time-and-Frequency-Localized Short-Duration Speech-Like Stimuli for Assessing Hearing-Aid Performance via Cortical Auditory-Evoked Potentials. Trends in hearing, 23, 2331216519885568.
Morten Bagger, MSc International Marketing, graduated from the University of Southern Denmark in 2009. Morten has been the Senior Product Manager within ABR and OAE at Interacoustics since June 2018.
Rasmus Skipper, MSc Audiology, graduated from the University of Southern Denmark in 2020. Following two years of clinical practice at Odense University Hospital, Rasmus joined Interacoustics in April 2022 as Clinical Product Manager within ABR and OAE.