Solutions / Balance Testing Equipment / How to perform the Saccade test
How to perform the Saccade test
How to perform the Saccade test
Learn how to perform the saccade test with videonystagmography (VNG) equipment.
VisualEyes™ Support
Saccades are fast and voluntary eye movements that bring images of a new object onto the fovea, which is part of the retina that is reponsible for successful visual acuity.
The saccade test measures the patient’s ability to accurately move the eyes from one designated focal point to another in a single, quick movement. The ability to accurately perform saccade testing assesses the patient’s central vestibular system. The random saccade paradigm has been established as the most useful for saccade testing; therefore, it is the random saccade test that is discussed in this paper.
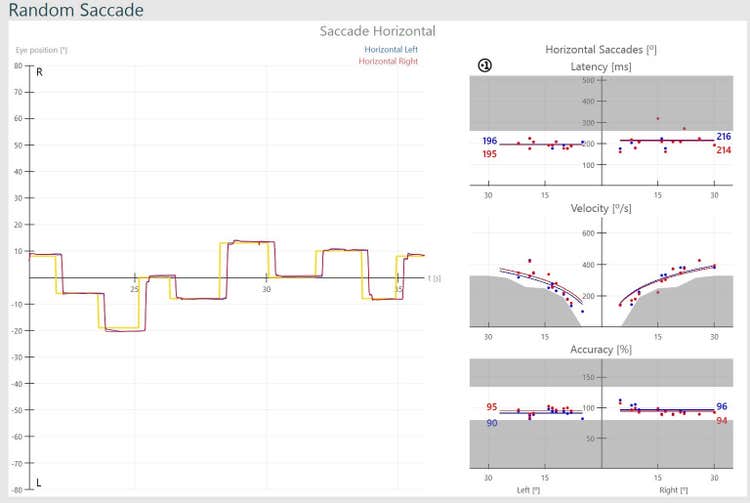
Saccade testing quantifies the latency, velocity, and accuracy of eye movements.
Latency corresponds to the time between initiation of target movement and initiation of eye movement. A prolonged latency is significant and can indicate basal ganglia disorders.
The velocity is how fast the eyes arrive at the new target position. Slow velocity could be associated with supranuclear palsy and brainstem or basal ganglia lesions.
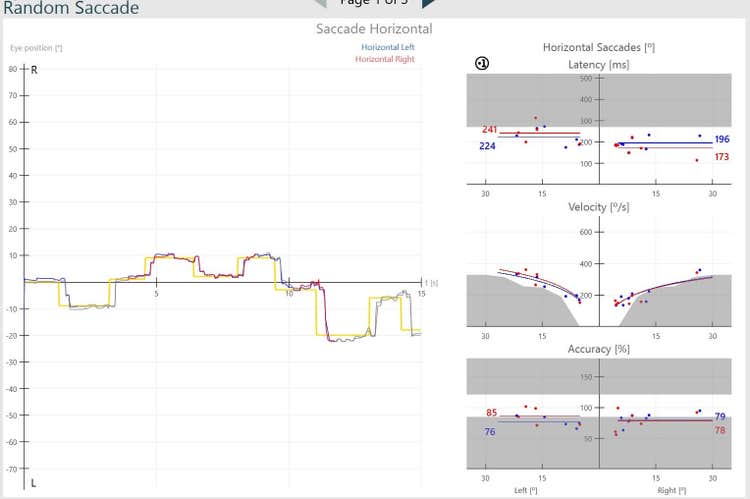
Accuracy measures if the eyes arrived at the target or if there were undershoots or overshoots. Undershoots or overshoots are signs of a problem in the cerebellar vermis that controls the accuracy of eye movements.
“You will see a green dot on the screen. Simply look at the dot. If the dot moves, follow it with your eyes only as quickly as you can. Try not to move your head.”
A patient with the ability to perform a saccade test normally will produce a tracing in which the stimulus target and the eye tracings are virtually identical. The stimulus is represented by the yellow target line and the right and left eyes are represented by red and blue tracings, respectively. The responses for each saccade are represented on the accuracy, velocity and latency graphs by red dots for the right eye and blue dots for the left eye. Responses that are within threshold limits will fall in the white region and responses outside of threshold limits will fall in the grey shaded region.
Contact your local distributor
Our world-wide experts are ready to help you find the right solution.