Solutions / ABR Equipment / Threshold Testing
Threshold Testing
Threshold Testing
Learn how to perform hearing threshold testing with the Eclipse evoked potentials system.
Eclipse Support
The Auditory Brainstem Response (ABR) is an evoked potential that originates at the auditory nerve (Cranial Nerve VIII) and the response is picked up by surface electrodes typically placed at Vertex and Left and Right mastoids. An ABR test is used to assess the auditory system’s function from the cochlea through the brainstem.
The response to auditory broad band or frequency specific stimuli is identified by “peaks” that occur typically between 1 and 15 milliseconds from the stimulus onset. The ABR peaks are measured and marked traditionally as I, II, III, IV, and V. Each peak has an expected latency range to be considered “normal”. Delayed or missing peaks are consistent with abnormal auditory function. The presence or absence of responses can be used to estimate hearing thresholds. An ABR threshold is an electrophysiological threshold that can be used to predict the behavioral audiogram. The difference between the two may vary quite a lot, but correction of 20dB at 500Hz, 15dB at 1kHz, 10dB at 2kHz and 5dB at 4kHz are typically applied correction factors.
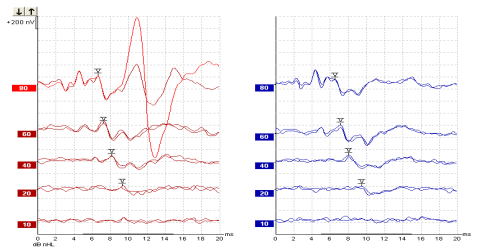
Threshold recording using 2kHz Tone Burst. Note the large PAM response from the right side caused by the loud stimulus of 80dBnHL. The ABR threshold at 20dB nHL at 2kHz found here would be well within the range of normal hearing - applying a typical correction factor would estimate the behavioral audiogram threshold to be 10dBHL at 2kHz.
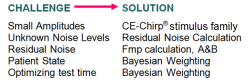
Challenges arise when evaluating hearing thresholds. They can include:
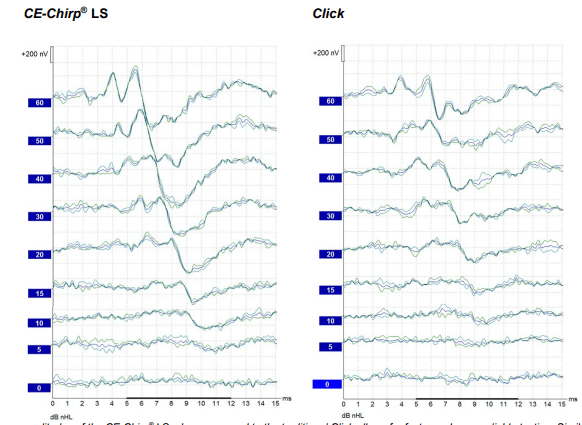
We know that as we get closer to threshold, the waveform latencies increase and the amplitudes decrease. This presents a challenge in “peak picking”. A solution is the implementation and use of the CE-Chirp® LS and NB CE-Chirp® LS. The CE-Chirp® LS Stimulus Family compares to the traditional click while the NB CE-Chirp® LS compares to traditional tone burst. Research indicates that the use of the CE-Chirp® LS and NB CE-Chirp® LS particularly at modest stimulation levels results in waveform amplitudes up to double that of traditional stimuli (Elberling & Don, 2008; Ferm et al., 2013). This is achieved by simply accounting for timing issues within the cochlea. If amplitudes can be increased, the ability of the user to quickly and accurately identify waveform peaks near threshold increases. This clearly reduces test time and increases user confidence. Please see example below.
The larger amplitudes of the CE-Chirp® LS when compared to the traditional Click allows for faster and more reliable testing. Similar benefits can be found when substituting traditional Tone Bursts with the NB CE-Chirps® LS.
Noise levels also create a challenge as noise can eliminate the ability to obtain or view the necessary waveform peaks. Lower noise levels increase the ability to identify the waveform peaks and increase the confidence of the presence or absence of a response.
Traditionally, users run a set number of sweeps in an effort to reduce the amount of noise in the recording. However, the number of sweeps may tell us little about the Residual Noise in the tracing. An objective Residual Noise measure should be used instead. Typically, if Residual Noise levels are 40nV or less, the tracing is sufficiently clean to be able to reveal a response if present. Therefore, Interacoustics implemented the Residual Noise calculation. The use of Residual Noise calculation either by monitoring or as a stop criterion greatly improves the certainty. The Residual Noise bar placed on the right side of the Fmp graph indicates the Residual Noise level and will turn green with a checkmark when the criterion for residual noise is reached (e.g. 40nV).

Contact your local distributor
Our world-wide experts are ready to help you find the right solution.